

The data used in this article came from this dataset. You can find an interactive version of the data and the graphs used in this article here.
It’s a simple question, and a common one: what country is the best at Eurovision? The answer, however, seems to be elusive. For one, there’s a somewhat subjective element to it in that everyone has their personal preferences on what countries send the best songs to the contest. But even if we put that aside, everyone seems to have a different answer. Is it Ireland, the country with the most wins? Is it Sweden, who’ve dominated the left side of the scoreboard in the last few decades? Is it Russia, who despite only winning the contest once almost always does better than anyone expects?
Music may be subjective, but when there are scores and places involved, that means there are numbers, and numbers don’t lie, right? So let’s see if the numbers reveal who really is “the best” at Eurovision.
Simply the Best
If we’re measuring who is “the best,” we should have a definition of what that means. At the most basic level, we can simply look at who has won the contest the most times, and that prize goes to Ireland, with seven wins.
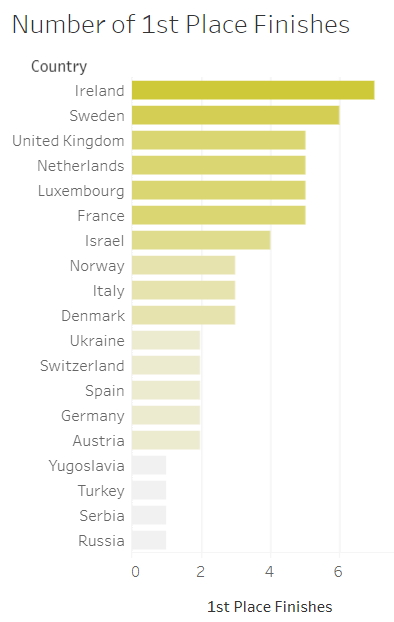
But there’s a small flaw in just measuring wins, and that particular flaw becomes pretty obvious if you look at Ireland’s actual Eurovision record. Sure, they’ve won seven times, but four of those wins came between 1992 and 1996, winning four of 5 contests in that short span of time. Not that these wins were undeserved, but while Ireland dominated in the 90s, their more recent record is, let’s say, less than stellar. Since the semifinals were introduced in 2004, Ireland have failed to qualify for the Grand Final more times than they actually qualified. Two of the entries that did manage to qualify came in dead last, while only two managed to reach the Top 10, with the last to do so being Jedward in 2012.
So we can probably agree that one really strong run in the 90’s doesn’t “the best” Eurovision country make, right?
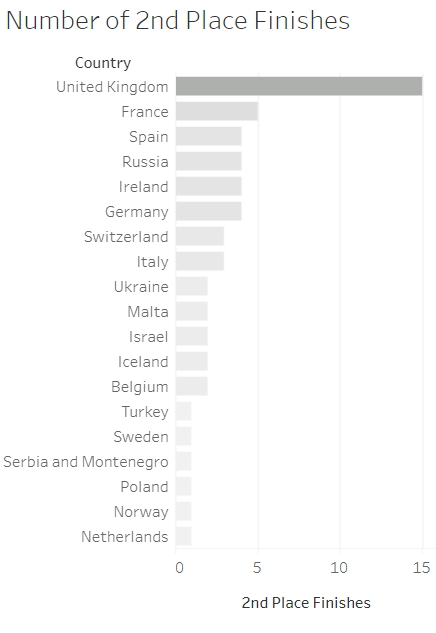
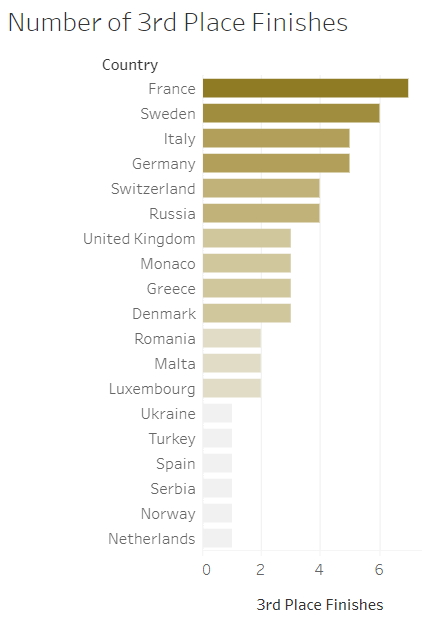
Ok, let’s expand our scope a little and look at other placement metrics. The UK has by far the most 2nd place finishes with 15 total. France takes the lead in 3rd place finishes with 7 total.
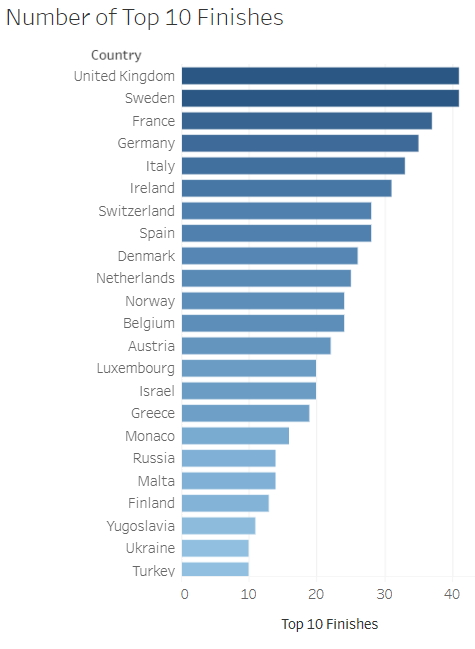
And if we take a look at the total number of Top 10 finishes, the UK and Sweden are tied at 41 (!!).
Good stats for the UK, historically speaking, but we run into several issues looking at these metrics as well. For one, the UK now has a reputation for being notoriously bad at Eurovision. Since their last win in 1997, the UK has placed in the Top 10 only three times but came in dead last in the Grand Final on five different occasions. This year, they even managed what seemed statistically impossible under the current point system: zero points from both the juries and the public.
Another issue is that looking at the contest’s entire history does end up giving an advantage to countries who have participated longer. Sure the UK has 5 wins and 15 second places – they’ve been participating since 1957! Seems unfair to compare the UK’s 41 Top 10 finishes when some countries have only been participating since the mid-2000s, right?
Also it’s a lot easier to place in the Top 10 when there are only a handful of countries participating, as was the case for the first few decades of the contest. 10th out of 16 isn’t as impressive as 10th out of 26. And that’s assuming you already (auto-)qualified for the Grand Final.
Who Qualifies for this Analysis?
So just looking at placements has some issues. Let’s try another metric entirely: a country’s record of qualification for the Grand Final. And let’s put aside the idea that any of the “Big 5” might be The Best – at best, their records in the contest are mixed, and at worst, dismal. (Don’t come at me, Italy stans).
Looking at the qualification rate alone, there are actually two countries in the contest’s history who have qualified for the Grand Final 100% of the time: Ukraine and…
Serbia and Montenegro, when they competed as one country.
That exposes the obvious flaw in this metric – there is an advantage for countries that have only competed a few times but done very well. Up until this year, Australia also had a 100% qualification record, but is it really fair to put them on par with Ukraine when the former had competed 5 times and the latter 15 times? And, technically speaking, Sweden has qualified for the Grand Final more times than Ukraine, but they did miss out one year and thus have a lower qualification rate.
So maybe the number of times a country has qualified is the better metric? Let’s compare number of qualifications (Qualification Score in the graph below) and the Qualification Rate
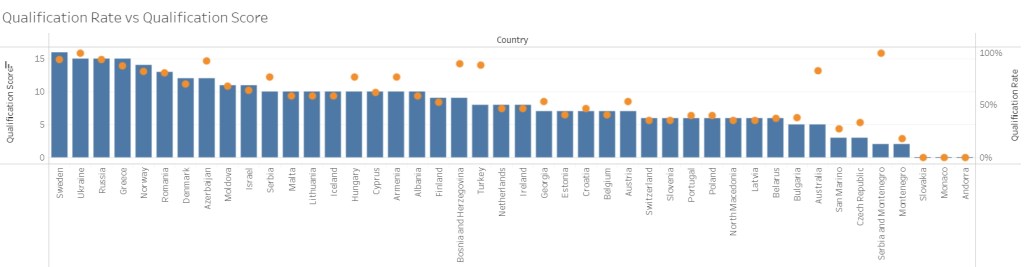
Sweden has the most qualifications with 16, and Ukraine, Russia, and Greece have all qualified for the Grand Final 15 times. Yet of these four countries, Ukraine still has the best qualification rate, with 100%.
So which do we give more weight to? The fact that we have to decide means that maybe this isn’t the best way to go about deciding who “The Best” is either. Maybe there’s a way we can get a definitive answer.
Average at Best
Ok, so just the number of wins and the number of top 10 placings and the number of qualifications doesn’t work. What if we then look at how a country does, on average, in the Grand Final? The table below shows us every participating country’s Average Placing in the Grand Final.
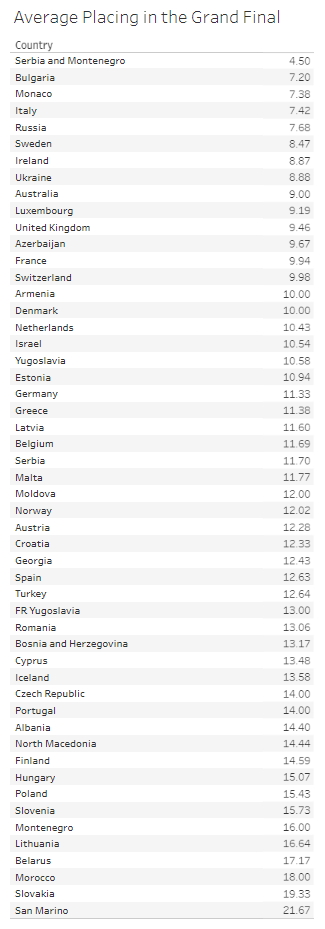
Ok, well there’s the Serbia and Montenegro problem again. An average placing of 4.5 is incredible, but they’ve only participated twice as a single entity, so maybe not entirely fair. And Bulgaria? Monaco? This smells fishy.
So just looking at Average Placing the Grand Final clearly biases countries with short but stellar runs in the contest. It also doesn’t account for the number of times a country hasn’t qualified for the Grand Final, meaning that Ireland’s run of NQs in the last decade would probably lower their score a bit, if accounted for.
But how do we account for it?
And the Winner Is…
To compensate for NQs and the fact that countries have continuously been added to the competition over the years, let’s do some more math. If we divide the number of years a country has participated by their average placing in the final, creating an “Ultimate Eurovision Score,” we may get a more accurate result of who “The Best” Eurovision country might be. Let’s see how that goes:
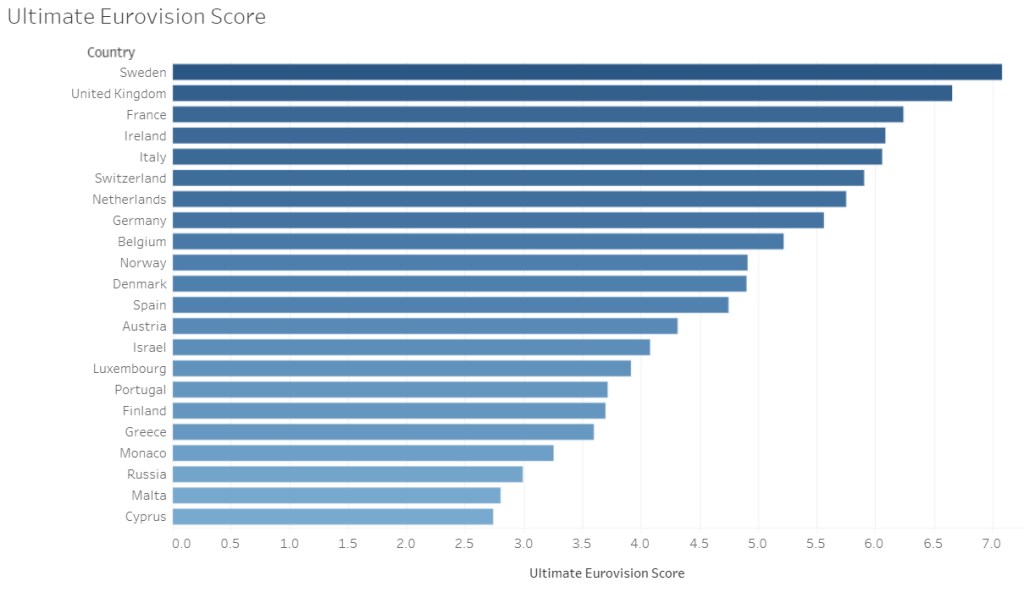
And the winner is – SWEDEN! With 60 years of participation and an average Grand Final placing of 8.47, the Swedes come out ahead of the UK, France, Ireland, and Italy.
Of course, this metric is not without its flaws. Again, countries that have participated since the beginning of the contest, when there were fewer contestants overall, have an advantage. By this metric, 16th out of 16 counts as much as 16th out of 43.
If we narrow the timeline to just account for participation since 2004, when the semifinals were introduced, it’s actually Russia that comes out ahead. Waaay Ahead.
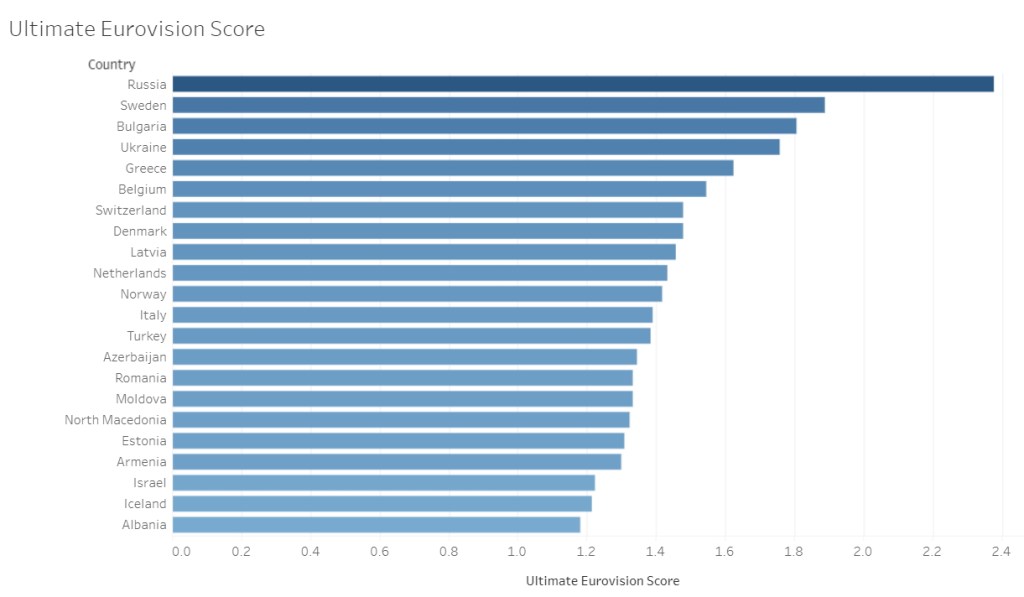
But is it fair to ignore the previous 48 years of the contest? Probably not.
So maybe the question of which country is “The Best” will never be answered. When looking at a contest that has been changing and evolving since its inception, not only in the amount of participants but in the way points are distributed and voting is conducted, data can only tell us so much. As the contest continues to live and grow, the answer to who is “The Best” at Eurovision may become clearer or, likely, more obscure.
But maybe it doesn’t even matter. Eurovision has always been more than a competition, so looking to find out which country is the best at it is probably missing the point entirely.
Inspired to do your own Eurovision data analysis? Check out our Data resource page for links to free Eurovision datasets to start your data journey! And of course, if you want us to publish your findings, click here!

You must be logged in to post a comment.